ACHIZIȚIA DATELOR
IN LabVIEW II
1. Obiectivele
lucrarii
a) To learn how to use
LabVIEW for analog input through a DAQ card.
b) To learn about Analog to
Digital conversion and how to acquire a signal and display it in LabVIEW.
c) To study the effect of
the sampling frequency in analog to digital conversion.
In this
experiment, you will write a LabVIEW VI to acquire an analog signal from the
analog input pins of the NI ELVIS, display it in LabVIEW, and calculate its RMS
and average values.
You will also
show the relationship of amplitude to number of averages. This lab requires background
in analog to digital conversion and the concepts of sampling and Nyquist
sampling theorem.
2.Aparatura si suporturile utilizate:
a) PC in configuratia unitate
centrala,monitor, tastatura;
b) NI ELVIS
c) Precizarile din prezentul
indrumar;
d) Manual de prezentare a mediului de
programare grafic LabVIEW.
3.Breviar
In 1928, H.
Nyquist showed that an analog signal could be perfectly reconstructed solely
from its sample values. This could be done without any loss of its original
information if the sampling rate is at least twice the bandwidth of the signal,
thus the famous rule:
Nyquist
sampling rate = 2 x signal bandwidth
For example, a
signal with a bandwidth of 1000Hz must be sampled at 2000 or more
samples/second without any loss of information.
Figure
1. Sine and cosine waves sampled at twice the signal frequency
Sampling at
exactly twice the signal frequency is not enough in most practical situations.
Figure1 illustrates this problem and it is a common practice to use a sampling
rate as much as 10 times the signal bandwidth is used when doing an anolog to
digital conversion.
Figure
2. Adequately sampled
signal and under sampled signal.
Quantization
Errors
The term
quantization error (or quantization noise) is used to describe the fact that a
digital value can correspond to a distinct span of analog signals. Any analog
signal within the zone of one LSB will have the same digital value and
therefore look identical to all others after the analog-to-digital process. It
is this small degree of error in misrepresentation that is known as
quantization error. In order to closely reconstruct the original analog signal,
the analog to digital conversion process needs to minimize the quantization
error as much as possible. To reduce the quantization error, more divisions
(higher resolution) should be used to represent the analog value.
Data Acquisition
using LabVIEW
As shown in the
figure above, LabVIEW initiates a DAQ operation by calling NI-DAQ which
contains the drivers for the board, i.e. signals the hardware to initiate the
I/O operation. DAQ boards use on-board buffers and RAM buffers as an
intermediate place to store the data they acquire. Also hardware can be used to
initiate the I/O operation, which is called a triggering.
Two important
steps will help to classify the type of DAQ operation:
. Whether you
use a buffer
. Whether you
use an external trigger to start, stop, or synchronize an operation
A Buffer is
an area of memory reserved as a temporary location for data. For fast data
acquisition, the DAQ board stores the data into a buffer immediately after
acquisition, so that it may be retrieved later for display or analysis. When
the PC memory is used for the buffer, it is called a DMA (Direct Memory Access)
operation. It is recommended to use the buffered I/O when you need sample more
than 10 samples per second. Nonbuffered I/O can be used for slow signals and
also reduces memory overhead for the PC.
Triggering
Triggering
refers to any method by which you initiate, terminate, or synchronize a DAQ
event. A trigger is usually a digital or analog signal whose condition is
analyzed to determine the course of action.
Software
Triggering is the
easiest and most intuitive way to do it-you control the trigger directly from software,
such as using a Boolean front panel control to start/stop data acquisition.
. The user
needs to have explicit control over all DAQ operation
. Timing of the
events needn't be very precise
Hardware
Triggering lets the
circuitry in the board take care of the triggers, adding much more precision and
control over the timing of your DAQ events. Hardware triggering can be further
subdivided into external and internal triggering. An example of an internal
trigger is to program the board to output a digit pulse when an analog-in
channel reaches a certain voltage level. An example of an external trigger is
to have the board wait for a digital pulse from an external instrument before
initiating an acquisition. Many instruments provide a digital output (or
"trigger output") for this purpose.
. Timing a DAQ
event needs to be very precise
. Need to
reduce the software overhead
. DAQ events
must be synchronized with an external device.
Functions in
NI-DAQmx.
All the
functions related to the data acquisition are accessed through NI DAQmx palette
located at Functions>> Measurements I/O.
1. DAQ
Assistant.
DAQ Assistant
is a graphical interface for interactively creating, editing, and running
NI-DAQmx virtual channels and tasks. An NI-DAQmx virtual channel consists of a
physical channel on a DAQ device and the configuration information for this
physical channel, such as input range and custom scaling. An NI-DAQmx task is a
collection of virtual channels, timing and triggering information, and other
properties regarding the acquisition or generation.
2. NI-DAQmx
Create Virtual Channel.
The NI-DAQmx
Create Virtual Channel function creates a virtual channel and adds it to a
task. It can also be used to create multiple virtual channels and add all of
them to a task. When a task is not specified, the function creates a task. The
NI-DAQmx Create Virtual Channel function has numerous instances. These
instances correspond to the specific type of measurement or generation the
virtual channel(s) perform.
3. NI-DAQmx
Timing.
The NI-DAQmx
Timing function configures the timing for hardware-timed data acquisition
operations. This includes specifying whether the operation will be continuous
or finite, selecting the number of samples to acquire or generate for finite
operations, and creating a buffer when needed.
4. NI-DAQmx
Start Task.
The NI-DAQmx
Start Task function explicitly transitions a task to the running state. In the
running state, the task performs the specified acquisition or generation. A
task will be implicitly transitioned to the running state, or automatically
started, if the NI-DAQmx Start Task function is not used, when the NI-DAQmx
Read function executes. This implicit transition also occurs if the NI-DAQmx
Start Task function is not used and the NI-DAQmx Write function executes with
its auto start input specified accordingly.
5. NI-DAQmx
Read.
The NI-DAQmx
Read function reads samples from the specified acquisition task. The different
instances of the function allow for the type of acquisition (analog, digital,
or counter), the number of virtual channels, the number of samples, and the
data type to be selected.
6. NI-DAQmx
Write.
The NI-DAQmx
Write function writes samples to the specified generation task. The different instances
of the functionallow for the type of generation (analog or digital), the number
of virtual
channels, the
number of samples, and the data type to be selected.
7. NI-DAQmx
Clear Task
The NI-DAQmx
Clear Task function clears the specified task. If the task is currently
running, the function first stops thetask and then releases all of its
resources. Once a task has been cleared, it cannot be used unless it is recreated.
Thus, if a task will be used again, the NI-DAQmx Stop Task function should be
used to stop the task, but not clear it.
4. Mod de lucru
a) Se alimenteaza sistemul
cu tensiune;
b) Se lanseaza mediul LabVIEW;
c) Se implementeaza programele descrise mai jos.
4.1 Acquire
Analog Input.
Objective: To use DAQ Assistant.vi to acquire analog
input.
1. On the NI
ELVIS protoboard connect the function generator output to channel ACH0+
and the Ground to ACH0-.
2. Switch on
the power supply for NI ELVIS station (Switch located on the back of the ELVIS
station).
3. Switch on
the power supply for prototyping board. Make sure that the three LED's on
the prototyping board are on.
4. On the NI-ELVIS
station front panel, in the function generator section change the
switch to
manual mode and select sinusoidal function.
5. Open a blank
vi and place the DAQ Assistant.VI located on the Function >>
Measurement I/O >>DAQmx palette on the block diagram.
6. A DAQ Assist
dialog box appears to help you configure the measurement task as shown in the
figure below.
7. Select acquire
signals >> analog input >> Voltage to create new voltage
analog input task.
8. The dialog
box then displays the list of channels on DAQ device installed. The number of
channels listed depends on the number of channels on the DAQ device. Select ai0
and click the finish button.
9. As shown in
figure below, a dialog box opens to configure the selected channel. Keep the
default settings for the signal input range, timing.
10. To check
whether channel is configured properly, click the run button locate on the top
left corner of the dialog box. Click OK on the dialog box to return to
the block diagram.
11. On the
block diagram, right click the data output on the DAQ Assistant and
select Create>> Graph Indicator.
12. Create rate
and number of samples controls for the DAQ Assistant.vi as
shown in the figure below.
13. On the NI
ELVIS front panel, in the function generator section, keep the
coarse frequency knob at 50Hz and fine frequency and amplitude
at the maximum value.
14. Save the VI
in your section's folder as "<lastname>_Analog Input.vi".
15. Run the VI
using rate 1000 Hz and number of samples 50, 100, 200 and 1000.
Notice the change in the time scale of the graph indicator when you
change the number of samples.
16. Keeping the
number of samples at 100, change the rate to 25, 50, 100, 500 and
1000. Notice change in the display of Graph Indicator.
17. Close the
VI.
4.2.
Statistical Analysis of the Analog Input
Objectives:
To analyze the analog input using Statistics .vi and understand the effect of
sampling rate.
1. Open the
"<lastname>_Analog Input.vi
2. Select the Statistics
Express VI from the Express>>SignalAnalysis sub palette of the
Functions palette and place it on your Block Diagram.
3. Keep the number
of samples at 200 and rate at 1000 Hz.
4. Wire the
data Ouput of the DAQ Assist VI to Signal input of Statistics
VI.
5. Right-click
the Arithmetic Mean output of the Statistics VI and select Create»Numeric
Indicator. This will create a numeric indicator on the Front Panel that
will display the Arithmetic mean. Repeat this step for the Maximum, Minimum
and RMS outputs of the Statistics VI.
6. Right click
on the block diagram and select Merge Signals from Express>>
Signal Manipulation.
7. Right-click
on the block diagram and select Express» Output» Write to Measurement
File.
8. Configure
the Write to Measurement as shown below.
9. Connect the Mean,
Maximum, Minimum and RMS outputs of Statistics Express VI to Merge
Signals and Connect the Merge Signal output to Write To
Measurement express vi as shown in the figure below.
10. Save the VI
in your section's folder as "<lastname>_SignalAnalysis.vi". Run the VI by
keeping number of samples at 200 and change the rate to 25, 50,
100,250 an 500 Hz. Fix the X-scale of the wave form graph to 0 to 0.2 sec.
Discuss the results in your report?.
11. Open the analysisData1.lvm
located in ME337L_F08/sec00# and make sure that data for each case is
saved in the file.
12. Use
excel to plot the data you have collected. Report the data as shown in the
figure below.
13. Save the VI
and exit.
4.3.
Acquiring Multiple Analog Inputs
Objective:
To use the DAQmx Data Acquisition Palette
1. On the NI
ELVIS proto board connect the function generator output to channel ACH0+
and the Ground to ACH0- and connect the +5VDC to ACH1+
and the Ground to ACH1-.
2. Open a blank
vi.
Select DAQmx Create virtual channel.vi located
in Functions>> Measurement I/O>> NI-DAQmx palette .
4. Right click
on the physical channel terminal and select create from the
shortcut menu and select constant. From the drop down menu of the
constant, select Dev1/ai0, as shown in the figure below.
Change the
content of this constant to include channel 1 as shown 
5. Right click
on the Minimum and Maximum values terminals of the DAQmx
Create virtual channel.vi to create controls .
6. Select Timing
.vi. located in Functions>> Measurement I/O>> NI-DAQmx
palette. This VI specifies the timing of the acquisition.
7. Connect the
error out and task out terminals of the Create virtual channel vi to the
corresponding terminals of Timing.vi.
8. Create
controls in the Rate and Samples per channel terminals of the Timing
vi and a constant in its Sample mode terminal.
9. Select Start
Task .vi. and DAQmx Read vi located in Functions>>
Measurement I/O>> NI-DAQmx palette. Connect the error out and task
out terminals of these two vi's.
10. Select the
drop down menu from the DAQmx Read vi and select Analog>>Multiple
Channels>>Multiple Samples>>1D Waveform, as shown below.
11. Create an indicator
in the Data terminal of the DAQmx Read vi .
12. Select Clear
Task .vi located in Functions>> Measurement I/O>> NI-DAQmx
palette. Connect the error out and task out terminals of the DAQmx Read
vi to Clear Task .vi
13. Add a Simple
Error Handler vi located in Functions>>Dialogue and User Interface
palette and connect it to the error out of the Clear Task .vi.
14. In the
front panel, change the representation of Data from Cluster to Waveform
Graph.
15. Save the VI
in your section's folder as "<lastname>_Multiple_Channels.vi".
16. Set the
Sample per channel to 100 and the rate to 1000 and Run the vi and report the
results.
17. To sample
the input continuously, change the Sample mode of the Timing VI to
Continuous Samples.
18. Include the
DAQmx Read vi and the Data Waveform in a While loop. Add a
control to stop the loop.
19. In the No
of samples per channel terminal of the DAQmx Read vi, add a control
and set its value to 100.
20. Save the VI
in your section's folder as "<lastname>_Multiple_Channels_Cont.vi".
21. Run the vi
and include the results in your report.
22. Close the
vi.
Voltmeter VI
In this exercise, the objective is to acquire an analog signal using
a DAQ device. Complete the following steps to build a VI that measures the
voltage that the temperature sensor on the DAQ Signal Accessory outputs. The
temperature sensor outputs a voltage proportional to the temperature. The
sensor is hard-wired to channel 0 of the DAQ device.
Front Panel
- Open a blank VI and build the front panel shown in figure 1.
|
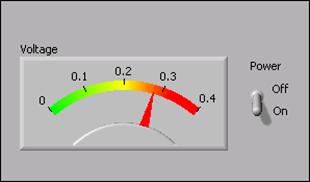
Figure 1
|
- Place
the
Meter, located on the Controls>>Numeric Indicators palette,
on the front panel. Configure the meter scale for to . Use the
Labeling tool to double-click and type . You
might need to enlarge the meter to display the scale as shown in the example.
- Place a
Vertical Toggle
      Switch
, located on the Controls>>Buttons & Switches palette, on the front panel. Configure the toggle switch to a
default value of False and a mechanical action of Latch When Pressed
- Create
two free labels,
Off and On, using the Labeling tool.
Block Diagram
- Build the block diagram shown in figure 2.
|
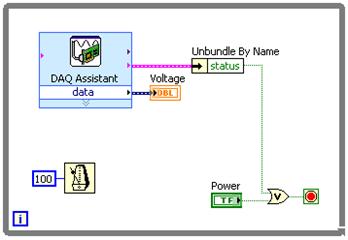
Figure 2
|
 Place
the
Place
the DAQ Assistant Express VI located on the Functions>>Input palette, on the block diagram. Configure this VI to read an analog input
channel and return the voltage.
- Select
Analog
       Input>>Voltage
for the measurement to
make.
- Select
Dev1>>ai0 for the physical channel.
- Click the
Finish button.
- The
Analog
       Input Voltage Task
dialog box appears.
Configure the Task
Timing to Acquire 1 Sample
- Click the
OK button to close the Analog Input Voltage Task Configuration dialog box. This saves the settings specified for the task in
the DAQ Assistant
Express VI.
 Place
the
Place
the Wait Until Next
ms Multiple function, located on the Functions>>All
Functions>>Time & Dialog palette,
on the block diagram. Right-click the input and select Create Constant from the shortcut menu. Type in the constant
to cause the loop to execute every 100 ms.  Place
the
Place
the Unbundle by Name function, located on the Functions>>All Functions>>Cluster palette, on the block diagram. Use this function to access the status from
the error cluster.  Place
the
Place
the Or function, located on the Functions>>Arithmetic &
Comparison>>Express Boolean palette, on
the block diagram. This function stops the loop if an error occurs or the
user clicks the power switch on the front panel.
- Save the VI as
Voltmeter.vi in the C:ExercisesLabVIEW
Basics I directory. You will use this VI later
in the course.
- Display the front panel and run the VI. The meter displays the
voltage the temperature sensor outputs. Place your finger on the
temperature sensor and notice that the voltage increases.
4.5. Voltage Output VI
In this exercise,
the objective is to output an analog voltage using a DAQ device. Complete the
following steps to finish a VI that outputs voltage from 0 to 9.5 V in 0.5 V
steps.
- Connect Analog Out CH0 to Analog In CH1 on the DAQ Signal
Accessory.
Front Panel
- The front panel is already built.
|
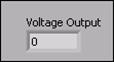
Figure 1
|
Voltage
Output displays the current voltage output.
1.b) Block Diagram
- Display and examine the block diagram.
|
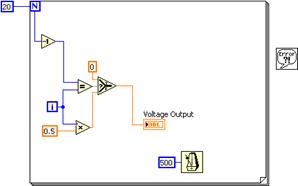
Figure 2
|
- The
Wait Until Next ms Multiple function
located on the Functions>>All Functions>>Time
& Dialog palette causes the For
Loop to execute every 500 ms.
 The
The
Select VI located on the Functions>>Arithmetic
& Comparison>>Express Comparison
palette checks if the loop is in its last iteration. If the loop is in
its last iteration, then the DAQ device outputs 0 volts. This is a good
technique to reset the output voltage to a known level. It is always a
good idea to reset the output voltage to something that will not damage a
device that is connected to the DAQ device.
- Modify the block diagram as shown in figure
|
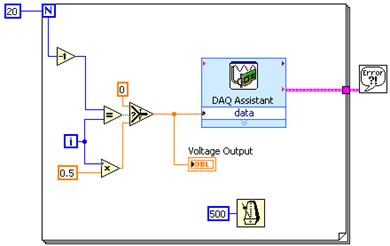
Figure 3
|
- Place
the
DAQ Assistant
Express VI, located on the Functions>>Output palette, in the For Loop.
Complete the following steps to configure this Express VI to generate an
analog output voltage.
a.
Select Analog
Output>>Voltage for the measurement to make.
b.
Select Dev1>>ao0 for the physical channel and click the Finish button.
c.
In the Analog Output
Voltage Task Configuration dialog box that appears,
configure the Task Timing to Generate 1
Sample. Change the output range minimum to and maximum to
d.
Click the OK button to close the Analog Output Voltage Task Configuration dialog box. This saves the settings specified for the task in the DAQ
Assistant Express VI
- Save the VI.
- Close the block diagram but leave the front panel open.