Regional Competitiveness Analysis: Process and
Measurement
The emphasis on regional
competitiveness has gradually gained lately in strength and scope. From the
first EU Reports on competitiveness
which signalled worrying trends relative to the competitive advantages in both
global and local contexts to the present strategic guidelines of the Community which
makes the competitiveness of regions a priority theme, the topic has come to
hold the centre stage at the European policy-making level. The renewed Lisbon
Agenda requires that 'the Union
must mobilise all appropriate national and Community resources - including
cohesion policy' and makes clear that greater ownership of
the Lisbon
objectives is only possible trough involving regional and local actors and
social partners (Commission 2005).
The development sources are regionally
divided in a strong relation to the local abilities to put at good use certain
common determining factors of the entrepreneurial initiative. Various regional
developments are accounted for by an emerging entrepreneurship potential,
independently of certain geographical cliché or of any deterministic nature.
The emergence of new perspectives in
creating competitive advantages at national level clearly emphasizes the role
of local factors and economic initiative in the general economic development of
a country through conceptual constructions such as industrial clusters or
districts, innovation networks or competence centres. However, at the same time
there is a reduced offer of empirical analysis which examines the relation
between economic initiative and local economical development systematically
(OECD 2003: p. 10; p. 13).
The regional environment is shaped by three
important groups of influences on entrepreneurship, namely factors specific to
the macro-climate, micro-climate factors and factors specific to each person.
The enterprise macro-climate is characterized by indicators which reflect such
aspects as regional infrastructure, regional cultural level, economic
situation, or political systems. All these factors however receive different
interpretations and therefore the micro-climate factors of the entrepreneur's
'world' are represented by this infinite variety of ways of
perceiving the surrounding reality. Thus, the reactions, the vision, the
strategy, the action manner, the efficiency and of course the success are
mostly the result of micro-climate factors beneficial for the enterprise
initiative. Another category of factors specific to the entrepreneur includes
age, gender, social status, education level; these factors can describe the
intensity of the latent enterprise initiative or the evolution of the already
manifested one.
The theoretical background increasingly
combines the macro aspects of industrial policy with the regional ones of the
economics of agglomerations. The EU experts wonder in a report of the European
Commission (2002) if cluster policy is not a way of reaching the EU landmark
objective of becoming the most competitive region in the world at the horizon
of 2010. The same study offers details that are less common for standard
economic texts: the initiatives dedicated to generating new businesses were
equally divided between medium and big urban localities, and rural ones and small
towns (European Commission 2002: p. 21). This is prima facie evidence regarding the existence of some conditions for
the development related rather to the economy of the region than to some
inherently better influences, of historical, psychological or any other nature.
Beyond the
academic preoccupation, it can be distinguished a reorientation of the public
attention towards this kind of problems. For example, if the annual
competitiveness reports of the European Union (EU) focused at the beginning only
on the comparison between EU and its advanced peers, the last reports reveal a
need of extending the analysis regarding the implications of the competitive
policies to a national level.
This particularly means that regional competitiveness plays a new, enhanced
role through its emphasis on regions that enjoy the biggest increases of
competitiveness. At the same time, the regional level of analysis also crosses
the national borders by drawing attention to the way the productive capacities
are reallocated in the widened European area especially because of the increase
of the industrial production in those fields where important economies of scale
(internal or external) can be achieved.
This material proposes first a review of the theoretical aspects of
regional competitiveness in order to enlighten the factors and analytical
approaches usually deemed relevant to determine which factors of local
development affect success or lead to failure. The second section offers a
first glimpse on the entrepreneurial potential of the Romanian regions.
Finally, in the third section, several indicators of measurement are discussed for
their significance in producing reasoned policy recommendations.
I Process
Irrespective of definitions, competitiveness is normally linked to
such tangible outcomes as continued productivity growth, high real wages and
standards of living, and vibrant processes of innovation. Conditions that are
necessary for the study of national competitiveness are likely to be common to
regional-level analyses, although in this latter case the usual constraints -
membership of a currency union, factor mobility, barriers to trade, absorption
of macroeconomic shocks - are indefinitely relaxed. At the same time, the
reciprocal relationship should also be considered especially in connection to
the cooperative behaviour on the international level.
If a definition is nonetheless required, regional
competitiveness may be defined as the ability of a region and, therefore, of
its public authorities, to retain its local businesses and skills base and to
attract foreign investment (CSR and the SME). Its competitive characteristics
are accordingly based, albeit not exhaustively, on:
- Infrastructure quality
- The general quality of the environment
- The quality of the region's research and innovation
centres
- The ability to retain and attract skilled manpower
- Taxation
- Workforce cost and quality
The normal analytical framework uses concepts from
- neo-classical
economics, which points to physical and human capital as key influences
- new
growth theory, which emphasizes that the accumulation of knowledge could
generate increasing returns, where knowledge is measured as the skills of
the workforce, such as education levels or spending on education, or
through measures such as R&D expenditure
- cost analysis,
which mainly relates to unit labour costs
- localisation/specialisation
effects, which takes into account that geographical industrial
concentration is the equilibrium outcome of countervailing forces
(centripetal and centrifugal)
However, the economists are well aware that growth and
competitiveness more often than not are not part of a positive correlation
implying that more growth is equivalent to improved competitiveness. It is for
this reason that an analysis of the unfolding developments should be carefully
considered against the theoretical background. In this sense, the EU adds
valuable clarifications to the understanding of the objectives of any
competitiveness initiative: 'The aim of the new regional competitiveness
and employment objective is to anticipate and promote economic change by
improving the competitiveness and attractiveness of EU regions.' (Commission
2005: p. 90)
There is a clearly defined tendency (Commission 2003: p. 131) to
link the concept of regional competitiveness to those circumstances of economic
activities conducive to clustering in a limited number of places and within
clearly defined boundaries. Clusters
are generally associated with better economic performance:
l
Financial
services in London
or on Wall Street
l
Fashion in
Paris or Milan
l
Entertainment
in Hollywood
l
Chemicals
in Basel area
l
Movie
production in Buftea area
The insights from the new
economic geography offer the basics of the economics of agglomerations (clustering):
l
Agglomeration of economic
activities is dependent on the force of dispersion and the force of
concentration
l
At very high trade costs,
industries will be forced to
develop locally
l
At very
low costs, necessary inputs can be delivered to wherever the factor costs are
lowest
l
The
agglomerations reinforce the comparative attraction of regional economies
Observations of various instances of regional development reveal
that non-codified knowledge plays a salient role in laying the foundations of
any form of local/regional economy. This tacit form of knowledge is
'sticky' because it borrows from local patterns of development and
consequently it is best transmitted via face-to-face interaction. Geographical
proximity matters because social capital - the standard representation of tacit
knowledge as factor of production - uniquely configures a region in terms of its
intrinsic conditions for competitive upgrade.
The breadth of regional advantage is twofold:
- Traditional vs.
science based - Competitive success is characteristic across technological fields
- Local vs. global
- Examples of cross border
regional clusters include
-Glass cluster in Upper Austria (A), Bavaria (D)
and Bohemia (Czech Republic)
-Textile cluster in Lower Austria (A) and Bohemia (Czech Republic)
-Technical cluster in Styria (A) and Slovenia
-'Dommel-valley' on the Belgian-Dutch border consists of regional clusters
of high-tech firms and knowledge organisations
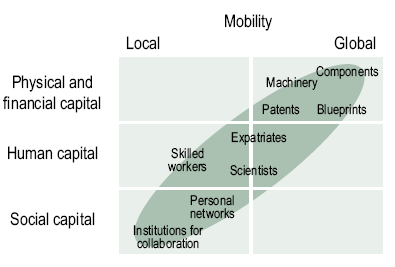
Figure 1. Capital and mobility
The Cluster - Standard definition and characteristics
Clusters are
geographic concentrations of interconnected companies, specialized suppliers,
service providers, firms in related industries, and associated institutions
(for example, universities, standards agencies, and trade associations) in particular
fields that compete but also cooperate. (Porter) From this definition results
that a typical representation of agglomerative economies is described
simultaneously by
l
Spatially
concentrated economic activities
l Critical mass of economic actors
l
Specialized
economic
actors
l Multiple actors, which addresses several a bundle of markets
l Competition and cooperation strategies involving the participants
l
Adaptation
over time among the various
actors that are interlinked through the cluster.
Regional competitive success is built on
such factors as:
l Clusters and Productivity
Access to Specialized Inputs and Employees
Access to Information
Complementarities
Access to Institutions and Public Goods
Incentives and Performance Measurement
l Clusters and Innovation
New buyer needs
New technological, operating, or delivery possibilities
Capacity
to act rapidly on these insights
l
Clusters
and New Business Formation
Barriers to entry
are lower than elsewhere
Better information about opportunities
Firms easily perceive gaps in products, services, or suppliers to fill
A lower risk premium on capital
A significant local market
Barriers to exit
can also be lower
l
Competition and cooperation within clusters
Vertical
relationships (those with buyers and suppliers)
Sharing
information that can contribute to new product and process developments or to
allow gains through better coordination of activities
Horizontal
relationships (those with direct competitors)
Tradeoff
between access to greater resources versus the potential for loss of
proprietary information or the creation of stronger competitors
Table 1. Activities that are
regarded as being of some importance or of importance for coordinating
activities among the firms in the clusters
|
R&D
|
Basic research
Applied research
|
|
Production
|
Production
Bundling of products and services from
several firms
|
|
Inputs
|
Joint purchase of raw materials, components
Joint purchase/carrying out of service
functions
|
|
Training
|
Management training
Other education or training
Technological survey
|
|
Marketing and sales
|
Market research
Joint branding
Joint selling activities
|
|
Logistics
|
Joint warehousing
Joint transportation
|
|
Government relations
|
Lobbying government
Coordinating public-private investments
|
Cluster analysis must
become part of competitive assessments, along with company and industry
analysis.
The appropriate
question for firms is not whether to compete or cooperate, but rather on what
dimensions to compete and on what dimensions to cooperate.
Private sector roles
in cluster upgrading can be found in all parts of the diamond.
Pitfalls
on the way to regional development
1) Sclerotic industrial agglomerations
l In the eighteenth century, Sheffield (United Kingdom)
was the world's leading supplier of cutlery. Sheffield
was known as the 'factory without walls' due to its concentration of
many small cutlery firms and suppliers.
In the late nineteenth century, Sheffield was overtaken by its long term
rival, Solingen, a similarly structured cluster
in Germany.
In the latter portion of the twentieth century, as Sheffield faded, a new
challenger emerged for Solingen.
Seki (Japan),
which has been called the 'Japanese Solingen,' is yet another cluster
of small and medium sized firms.
In the early 1990s, there were approximately 300 cutlery firms in Solingen and 600 cutlery firms in Germany have
been neck and neck as the world's leading exporters of cutlery since the 1970s.
2) The low end of high tech - the technological
threshold
Table 2. Examples of regional clusters (S= Science based; T= Traditional)
|
Country
|
Cluster name
|
|
Finland
|
Technology
Cluster in Oulu (S); Shipbuilding in Turku (T)
|
|
Germany
|
Chemical
Industry, Northern Ruhr area (S);
Enterprise-information-system, Lower Saxony (S); Media Cluster; North
Rhine-Westphalia (T)
|
|
Greece
|
Industrial
District of Volos
(sundry metal products and foodstuffs) (T); Industrial District of Herakleion
(foodstuffs, non-metallic minerals) (T)
|
|
Ireland
|
The
Dublin Software Cluster (S); The Dairy processing Industry (T)
|
|
Italy
|
Biomedical
cluster in Emilia-Romagna (S)¸ Eye-glass cluster in Belluno County (T)
|
|
Spain
|
The
Cluster of Machine-Tools in the Basque Country (S); Shoe Manufacturing in the
Vinapoló Valley (T)
|
|
United Kingdom
|
Cambridgeshire
(High-tech) (S); British Motor Sport Industry, Oxfordshire/ Northamptonshire
(T)
|
Source:
European Commission, 2002
Policy
initiatives
Analytical framework (Hoover and Giarratani):
1. Causes of growth. Why do some regions grow faster
than others? What are the primary initiating factors responsible, and through
what processes do these causes operate? What is the role of interregional
trade, migration, and investment in the spread of development from one region
to another?
2. Structure. How does regional economic structure
relate to growth? What kinds of structure are conducive to growth, or the
reverse? What structural changes are associated with growth?
3. Convergence. Why is convergence so much in
evidence? Is it universal and inevitable, or is it subject to reversals?
4. Control over regional development. Can
regional development be substantially guided by policy? If so, what are
defensible objectives and appropriate policies?
On overview of the European policy initiatives is provided by Table A1
in Annex.
Specific initiatives:
Taking account of specific
geographic situations
Certain territories experience
Competitiveness handicaps that are
hard to overcome
General initiatives:
Developing regional innovation structures, based on region-specific
priorities, needs, circumstances and preferences that vary depending on the
period of time and the region in question
Stakeholders industry
and trade, universities, technical universities, research institutes
Policy actions: industry-specific
education and training programmes, to familiarise people in the use of new work
methods and tools; to ensure the availability of competent workforce while
considering the regions' changing economic structures, the provision of
entrepreneurship training, from primary school to university, to promote the
development of services and markets that support entrepreneurship, to adapt
technologies and procedures that can change existing production structures and
enhance overall productivity.
II Entrepreneurial potential of the Romanian regions
This section attempts to glance through the
workings of the real economy with the help of some empirical evidence on the
Romanian economy. Against that background, a methodology to link development to
entrepreneurship is proposed and subsequently discussed. Given the limitations,
the dataset has been selected with respect to the longest possible list of
economic and social-cultural aspects which by and large correspond to the
macro- and micro-climate of influences on entrepreneurship. A set of thirty-three
indicators
has been processed for all 42 regional administrative counties / units with the
help of the statistical software SPSS, using the cluster method. This cluster
method is based on a specific algorithm for an optimum grouping of the counties
depending on the similarities and differences between the selected indicators.
The programme groups similar counties based on the selected indicators while
the particular cases presenting specific properties much different from the
other cases, appear separately.
The 'cluster' number or the
number of similar areas (counties) has been set to eight. This option is
sustained by the argument that there are as many development regions, and by
analogy there can be observed how the counties fare in this statistical
investigation as opposed to their administrative location. On the other hand,
other types of divisions which were experimented, for example in groups of 2,
4, or 6, frequently led to many groups represented by only one county that made
the analysis highly irrelevant.
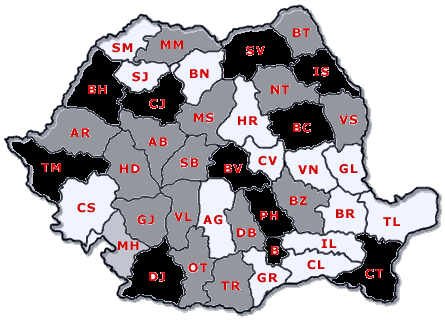
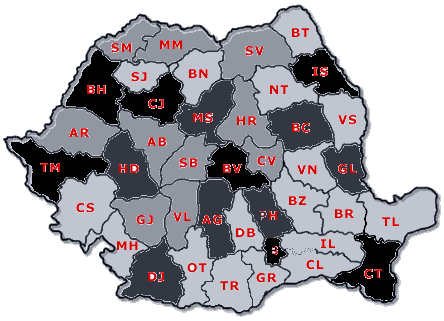
The conclusions include observations on
various iterations depending on different combinations of the chosen
indicators, but a special significance has been given to the combination that
gets together the whole set. Particular references are made only to this latter
case. The results are given in Table A2
and Figures A1 and A2 in the appendix. The findings
attempt to reveal local areas of development (counties) with a developed
entrepreneurial spirit, those that possess such potential and those with a poor
situation and contrast these more nuanced results with the familiar image of,
say, discrepancies between the advanced West and the poor East.
There should be first noted that the
processed data reveal several 'isolated' countries/areas-Bucuresti,
Arges, Constanta,
Mehedinti-which for some reason singularize themselves. As expected, Bucuresti
comes highly on top with extremely positive levels on all indicators, with the
exception of the criminality rate, in comparison to the rest of the country. As
for the other groups, they usually expose a particular combination of
favourable and less favourable characteristics that require interpretations
from case to case. For example, Constanta
appears to have a somewhat established entrepreneurial environment, but what
sets it apart is a very low level of development in the research area. Due to
an exceptionally high level of activity in two service sectors-tourism and
transportation-that do not require big product development expenditures, the overall
score may still rank this county in the top league. However, in order to
improve the accuracy of assessments in such cases, Table A2 enlists what are the common characteristics of each
cluster and Figure A2 is added to
illustrate a narrow representation of development which is based on a selected
set of indicators of mainly economic nature.
More interestingly, the forming of a
cluster of counties with very good performance levels-Brasov, Timis,
Cluj, Iasi, Bihor, Bacau, Galati, Prahova, Mures, Dolj (Table
A2, second row)-is suggestive of a remarkably even distribution of
entrepreneurial activity throughout the country. According to the logic of this
methodology, these counties show the highest level of the enterprise
development. Two observations arise in this context. First, this group features
a sub-cluster consisting of Brasov,
Timis, Bihor, Cluj, and Iasi
that preserves its particularities over repeated iterations. On the basis of
previous commentaries, adding to the large group Bucuresti, Arges and Constanta will make up for a more faithful illustration of
the first tier of entrepreneurial development in Romania. Second, it should be also
noted that several counties in this group disproportionately take advantage of
the presence of either a large company (e.g. Dolj-Daewoo Automobile, Galati-Mittal
Steel, Arges-Renault), or
industry (Prahova-crude oil). It is under these circumstances that the limits
of the statistical investigation become mostly visible.
There are still other several counties with
a manifest good potential for enterprise development, but in their case
adequate support programmes are needed. For counties like Arad,
Sibiu, Alba, Satu-Mare, Maramures, Valcea, Gorj,
Covasna, Harghita, and Suceava an encouraging environment for economic
initiative develops amidst slight 'sparkles' in certain fields and
small disequilibrium in others. Rest of the counties finds below or much below
average for most of the relevant indicators. In these cases, complex projects
will be necessary in order to bring them to acceptable levels of development. A
list of the worst performers-Ialomita, Caras-Severin, Giurgiu,
Vrancea, Calarasi, Dambovita, Vaslui, Botosani-makes
clear that at least as far as the bottom rank is concerned there is distinct
localization of problematic issues that follow the South - South-East - East
alignment.
A notable implication of the analysis
consists in the strength of the interdependence between the economic factors
and the social-cultural ones within a region. Generally, it may be noticed that
counties with a good economic milieu also present a favourable social-cultural
situation; the relation goes the other way around too.
These estimates reache results that are
similar to conclusions of reports touching on the same topic (e.g. UNDP 2004).
It nevertheless advances the discussion by finding similarities over a mixed
set of influences on entrepreneurship across Romanian regions. The conclusions
come in two areas of interest.
Firstly, the results underpin a view on
enterprise dynamics that may be reasonably divided in three areas of development.
There is first a group that shows a favourable climate for enterprise
initiatives, from business performance to market networks and supporting social
infrastructure. There are then counties satisfactorily positioned to outgrow
their present medium-level enterprise development level. They certainly have
strong advantages that must be further pursued, but at the same time favourable
conditions must be created for the diversification of the regional enterprise
initiatives. Through inadequate policies, these areas with potential can be
forced towards involution as well, and it is precisely for this reason that
this case requires special attention. Finally, the remaining counties expose
such a large range of unsuccessful achievements that makes them unattractive
for business development.
Secondly, it is somehow part of the
intellectual tradition the fact that regional development should be understood
in terms of different business habits, favouring 'mentalities', in
general, inherently better conditions in certain regions as opposed to others.
This investigation acknowledges indeed different practices with regard to
regional business initiatives, but the abilities for the establishment of some
thriving economic activities find a favourable environment for manifestation in
any region. The variety of local conditions and capabilities forms a particular
development fabric which should be put to good use through public policies and
business strategies.
III Measurement
This section deals with how to measure
regional competitiveness and its main determinants. Although there is no
universally accepted definition of regional competitiveness, this concept is
intended to measure the level of economic success displayed by regions. This is
usually done by constructing a set of indicators and then comparing them,
across regions, in order to quantify the level of success each region has
achieved. The usefulness of this exercise is to see whether the factors
underlying success can be applied elsewhere, notably in regions that perform
more poorly.
Although both theoretical and empirical
work have generated a series of indexes that assess a region's competitiveness,
a few issues need to be addressed first, namely:
What are the determinants for regional development?
Which indicators are most appropiate to describe the level of
regional development?
What do these indicators imply for the direction of causation
To what extent data availability allows regional analyses in
comparable terms.
As a general rule, competitiveness is
determnined by productivity, defined as a the output value per units of input,
with which a region employs its human, capital and natural resources. In turn,
productivity sets a region's standard of living as reflected by wage level,
returns on capital and human resources. In fact the link between productivity
and 'per capita' GDP is quite strong. This can be seen by breaking down the
'per capita' GDP indicator into a series of component factors:

(Productivity) *
(Work-Leisure choice) * (Employment Rate) * (Demographic Factor)
Thus, one of the most common regional
indicator used in practice to measure a region's economic success is the GDP
per capita. In the expression above productivity is defined as GDP/hours
worked. In contrast to the other way of measuring productivity, GDP/employee,
the GDP/hours worked indicator has the advantage of measuring more accurate the
labour effort, an important consideration when particular sector activities
require different profiles of work intensity.
A variety of general factors affecting
competitiveness are suggested by the literature (see Figure 1.3). For instance,
neoclassical theory stresses out the importance of physical and human capital
assuming that technological influences are exogenous. To remedy the ad hoc
assumption of exogenous technological influences, the growth theory endogenised
technology within the system, suggesting that the accumulation of knowledge
could generate increasing returns - as brought about, for instance, by human
capital accumulation.
Another stream of economic theory has
attempted to explain regional competitiveness using the geographical
concentration approach.
Figure 2. Regional Competitiveness Theories
The Neoclassical View
Initial Conditions
Level of Investment
Human Capital
Technology Driven
|
Growth Theory
Endogenous Technological
Advance
Externalities
|
Regional
Competitiveness
GDP/Employee
GDP/Hours Worked
|
Economic Geography / Trade Theory
Agglomeration Effects
Urbanisation
Transport Costs
Economies of Scale
Sectoral Specialisation
|
Knowledge-Based Factors
- input measures (human
capital, R&D infrastructure, investment in R&D, number of
researchers)
-
output measures (patents, process and product innovation)
|
Cost Competitiveness
Unit Labour Cost
Price of public input
Ratio of prices tradeable/nontradeable
|
Source: Adapted from the European Competitiveness Report, 2003.
Cost competitiveness is another way through
which regional competitiveness can be assessed. Economic theories that focus on
cost are Ricardo's comparative advantage or Heckesher-Ohlin's trade thory. The
unit labour costs (ULC) is a more direct way of measuring how expensive is
production in a given region. ULC is defined as the ratio of labour costs per
unit of output. Here, the former includes both the gross wage as well as
indirect costs per employee. Thus, higher ULC implies a loss of
competitiveness. This rises when the increase in labour costs is higher than
productivity increases.
Obviously, different theories would require
the usage of different indicators. However, in practice, a number of indicators
could have similar informational content. Therefore the challenge is to select
the most relevant indicators that would hold the highest explanatory power in
assessing a region's competitiveness. The most common used indicators are
listed below:
Gross Value Added (GVA). It
gives an indication of the value of economic activity in the region. It usually
allocates the incomes received by employees to where they work. Often, the
GVA/head figure is reported.
Gross Disposable Household
Income. It measures the income received by households and implicitly, living
standards.
Labour Productivity. This is
computed as GVA/workforce job and could be assessed within different sectors of
the regional economy ie industry, services, etc.
Investment by domestic and
foreign firms. It expresses the potential future output growth of the region as
it represents addition to the region's capital stock. A common proxy for
investment is the net capital expenditure made by firms.
The Value of Exports. This is
dependendent of the size of the regional economy. In the long run it is solely
the increase in export value that ensures the expansion of the regional
economy.
Average Earnings. This
indicator measures the marginal product of labour and it is usually expressed
as hourly earnings. Often it distinguishes gender pay, overtime and full time
pay.
Employment and Unemployment
Rates. These quantify the region's workforce participation rate.
Business Registration and
Survival Rates. One indicator of business formation is the number of new VAT
registrations each year as a percentage of firms registered for VAT at the end
of that year. The survival rate reflects the number of firms - as given by the
VAT registrations - still in business after a certain number of years.
Entrepreneurship. The indicator
aims at measuring the contribution made by entrepreneurs to the regional
economy.
Knowledge could be measured as the skills of the workforce, such as
education levels or spending on education, or through measures such as R&D
expenditure. The latter can, in
principle be computed for three sectors - government, business, and
higher education establishments - although in practice data availability
constraints makes the choice of total R&D expenditure preferable in orderer
to ensure reasonable coverage across space and time.
Innovation can be proxied by the R&D expenditure, expressed as
above. Another way to measure innovation is by the percentage of firms that
report co-operation agreements on innovation activities.
The stock of human capital can be proxied by the working
population - by age structure if
necessary - personnel employed in R&D, employment in high-tech sectors,
total number of students and those involved in tertiary education.
Transport Infrastructure. This indicator could have many
subcomponents but the relevant ones are the mode of transport to work and the
average speed on roads.
Industrial property and office rental costs.
There are other factors - as suggested by theory - which can have an
effect on competitiveness but for which there is no quantifiable approximation.
For instance, much of government policy falls under this category, as do
indicators measuring the extent of venture capital activity, business
registration rates, and the presence of high-tech clusters. However, such
features can be examined to see whether they are present in the characteristics
of those regions which display them. In addition other factors such as the sectoral structure, investment or the degree
of spillover effects are important when assessing a region's competitveness.
Empirically, the most prosperous regions have high share in market
services, usually, over 70%, but success tend to depend on the type of market
service which dominates. For instance, tourism services are not associated with
particularly high productivity levels. Investment measures the change in
capital stock of a region's economy and is an important indicator of future
output performance.
While indicators are useful in assessing a region competitiveness,
most of the times these are computed in isolation. Creating a composite index
at the local or regional level - that would comprise information contained in a
number of different single indicators - would be a step forward. To date, there
a number of organisations that compute such indices, a review of which is
presented below:
The World Economic Forum (WEF) Index - Global Competitiveness Report
1999. This is one of the most complex attempts to date to construct a composite
competitiveness index. It has been devised with inputs from Porter (1999). The
index is based on quantitative and qulitativ data classified into eight groups
with a weight of 75% for the former. Furthermore, the WEF Index assigns the
following weights to each of the eight groups classification indices as
follows: openess, finance, government and labour 1/6 each, infrastructure and
technology 1/9 each, management and institutions 1/18 each. The weights are
chosen through regression analysis looking at the correlation coefficient with
the per capita economic growth.
The 3-factor model (Huggins, 2003) is a composite index which
incorporates data available at local, regional and national level. The index is
based on three components, inputs, output and outcomes. The variables used to
construct the composite index - and their associated weights in brackets - are:
a)
business density measured as
the number of firms per capita (0.111).
This is a measure of the potential future development of new firms.
b)
proportion of knowledge-based
businesses measured as the share of knowledge-businesses in total businesses
(0.111).
c)
GDP per capita, measures the
historical impact of competitiveness (0.333)
d)
average earnings, with high
earnings being usually an indicator of high competitiveness (0.166)
e)
economic activity rates which
is a measure of how human capital is employed in a region (0.111)
f)
unemployment (0.166)
Huggins (1999) calculates such a UK Competitiveness Index for all
regions of the UK
allowing for different weighting systems that could influence the scores and
rankings of the index. The author's result are somewhat encouraging in what
different weighting systems does not change significantly the rankings of the
index.
United Nations Industrial Development Organisation (UNIDO). UNIDO
produces a scorecard which is comprised of two rankings:
1) A competitive industrial performance index on the basis of four factors and
2) A ranking of economies by the five drivers of industrial performance,
namely: knowledge, inward openness, financial system, governance and the
political system. All these five factors are obtained through multivariate
analysis
from an intial set of 29 relevant indicators. Out of the five indicators,
knowledge is by far the most important one and comprises of variables which are
highly correlated with the creation, diffusion and use of knowledge such as
R&D and innovation or quality mangement and education. The inward openess
has indicators pertaining to import trade and inward FDI. The financial system
indicator refers to aspects such as market capitalisation, country risk and
access to credit.
The Development Report Card produced by the Corporation for
Enterprise Development, which generates three indices:
a)
Performance Index which measures the following: employment,
earnings and job quality, equity (with respect to income), quality of life,
resource efficiency and a number of trend indicators which measure changes in a
set of variables.
b)
Business Vitality Index which
comprises of indicators reflecting cometitiveness of existing businesses, entreprenurial
energy, and trend indicators
c)
Development Capacity Index
which includes information relating to human, fiancial and infrastracture
resources, innovation assets, amenity resources and trend indicators.
The grades are computed as follows:
Raw data are collected for all
the 68 measures contained in the indicators above.
Each state is individually
ranked from 1 (best) to 50 (worst) in every measure based upon the raw data
obtained.
To calculate both the index and
subindex scores, the relevant measure rankings for each state are added
together. Again, the scores are ranked from 1 to 50.
States that rank from 1-10 earn
'A's, those ranking from 11-20 earn 'B's, states that rank from 21-35 earn
'C's, those that rank from 36-45 earn 'D's and states ranking from 46-50 earn
'F's.
When a tie occurs, each state
receives the same rank and the next best performing state is ranked as if the
tie had not occurred. For example, if two states have the best score, each
receives a '1' ranking and the next state is ranked '3'.
References
Bergman, Edward M. and
Edward J. Feser, Industrial and Regional
Clusters: Concepts and Comparative Applications, West
Virginia University's Regional Research Institute, Electronic version, [https://www.rri.wvu.edu/WebBook/Bergman-Feser/contents.htm][26.10.2006]
Commission of the European Communities, 'Cohesion Policy in Support of Growth and
Jobs: Community Strategic Guidelines, 2007-2013', Com (2005) 0299, Brussels, 05.07.2005
Commission of the European Communities,
'European Competitiveness Report 2003', Commission Staff Working
Document, SEC(2003)1299, Brussels,
12.11.2003
Commission of the European Communities, 'Final Report of the Expert Group on Enterprise Clusters and Networks', Enterprise Directorate-General, Bruxelles,
2002
Commission of the European Communities, 'Regional Clusters in Europe.'
Observatory of European SMES (3), 2002
''CSR in the SME and Regional
Competitiveness' Working Group : Introduction'
[https://ec.europa.eu/enterprise/csr/documents/mainstreaming/ms_sme_topic1_discussion_en.pdf]
[26.10.2006]
Department of Trade and Industry (DTI), Regional Competitiveness & State of the Regions, URN 06/259, July 2006.
Hoover, Edgar M. and Frank Giarratani, An Introduction to Regional Economics, 3rd
Edition, West Virginia University's
Regional Research Institute, Electronic version, 1999
[https://www.rri.wvu.edu/WebBook/Giarratani/hoover.htm] [Oct. 2006]
Huggins, Robert, Creating a UK
Competitiveness Index: Regional and Local Benchmarking, Regional Studies, Vol. 37.1, pp.
89-96, 2003
OECD, Entrepreneurship
and Local Economic Development, Paris, 2003.
'Towards a New Regional Policy in
2007', Report adopted by the CPMR Political Bureau, Kastoria (Greece), 21 January
2000 [https://ec.europa.eu/regional_policy/debate/document/futur/organ/crpm_kastoria_jan00_en.pdf]
[26.10.2006]
United Nations
Development Programme (UNDP) (2004), 2003-2004 National Human Development Report.
Romania,
[https://www.undp.ro/publications/pdf/NHDR2005eng.pdf]
[20 February 2006]
United Nations Industrial Development Organisation (UNIDO). Capability
building for catching-up. Historical,
empirical and policy dimensions, Industrial Development Report 2005
West Finland Alliance (WFA), 'European
Union's Regional and Structural Policies after 2006 Regional Points of
View', 24.4.2003